
“It felt busy.”
Here’s what we measured.
Two offices that share one team of dentists and specialists had seen new patients slow. They are part of a 50+ practice DSO, and they wanted more new patients and a straight answer about where they came from. Here is what we did, what moved, what the office told us, and what we still don’t claim.
- request-page activity
- 31.5×About 21 → 656 a week, both practices, estimated from the site’s chart
- new inquiries
- 181Counted by Meta, July 9 to September 10, 2026
- per inquiry
- $34.63Across all 34 ads, by Meta’s own reporting
- of filming
- 1 dayTwo offices, during a normal working day
The story
Before: a monthly report, and a doubt.
The two practices share one team of general dentists and specialists. New-patient volume had slowed after they moved away from many PPO plans, according to the client. Another agency ran their Google Ads and sent a report once a month.
The report said the marketing was working. Nobody at the DSO could check it.
“[The agency] does a good job of claiming that they are responsible for all of our new patients. I don’t know if that’s true or not.”
The brief: a reason to be chosen.
A list of procedures would not explain why someone should trust these offices. The people would. The practice set a people-first brief and a new-patient goal for both offices.
“We want the marketing to highlight the people, not just the services.”
The shoot: we put the people on camera.
We filmed at both practices during a normal working day: doctor interviews, staff introductions, office footage, and patients who signed HIPAA releases to tell their story on camera.
One office serves a largely Spanish-speaking community, so Spanish-language ads were planned from the first script, not translated at the end. Each practice’s website got request-appointment pages built to match the ads, so every ad led to the right office.
“We’ve had an eventful day in both of our offices… There’s a lot of moving parts, patients, staff, and they just seamlessly come in. It was an easy experience to work with you.”
The campaign
Live: people responded to people.
From July 9 to September 10, 34 ads ran on Meta and were seen 364,574 times. Each appointment form showed which ad and page it came from. Who was in the ad, and which language they spoke, mattered more than how many ads we made.
- May 12The practice set a people-first brief and a new-patient growth goal for both offices.
- JuneWe planned interviews, patient stories, staff introductions, office footage and Spanish-language content.
- June 24Filming took place at both locations during a normal working day.
- July 8Nine ads went live, with more variations to follow.
- July to AugustWe added creative variations, improved location routing and refined the request pages.
- September 10The reporting export captured 34 ads and the results in this case study.
What the paid campaign delivered
All 34 ads, July 9 to September 10, 2026, as Meta reported them.
What Meta counted
The result is an event named “new inquiry”. Meta credited each one to an ad using that ad’s attribution setting, mostly a 7-day click, 1-day view or 1-day engaged-view window.
An event is not automatically a unique person, a qualified lead, a booked appointment or revenue. Those take the practice’s own contact and appointment records.
- Spend
- $6,267.57Paid to Meta, USD
- Impressions
- 364,574Times an ad was shown
- CPM
- $17.19Spend per 1,000 impressions
- Inquiry events
- 181Counted by Meta
- Cost per event
- $34.63Across all 34 ads
- Ads with results
- 11Of 34 ads
One ad carried most of the response.
The strongest ad was a Spanish-language story told by a real person, not an actor. It produced 111 events at $20.79 each: 61.3% of all results, on 36.8% of the spend.
Put several believable messages into the market, watch where the response concentrates, and move budget toward the clearest winner. The 23 ads without a result used $494.65, 7.9% of the spend.
Source: Meta Ads Manager ad-level export, downloaded September 10, 2026. Spend and impressions are summed across ads. Reach is not totaled, because one person can see more than one ad.
The website
More activity on the request pages, and we could see where the forms came from.
At the two pilot practices, weekly activity on the request-appointment pages rose about 31.5× after launch (about 21 to 656 a week, both practices combined, estimated from the site’s chart). It is not a count of visitors, bookings, patients or revenue.
The 21 is the average of the 26 complete weeks before launch, while the previous agency ran Google Ads. The 656 is the average of the first six complete weeks after. Every one of those six weeks was above 600.
Each form showed which ad sent it and which office it was for. In the first weeks some came from out of state, so we tightened the targeting.
Combined Request Appointment page activity
What these numbers are not. The weekly request-page figures are estimated from the website’s analytics chart, not exported counts, and because the starting point was so low, small rounding changes move the 31.5× a lot. They are not visitors, bookings, patients or revenue. Meta’s reporting is Meta’s own, under the settings in its export. Everything rose together after launch. That does not prove one ad caused every result, and no practice should read it as a promised outcome: results vary, and we don’t guarantee them.
The pause: the phones went quiet.
After the first run, the ads were paused for a few weeks. The office noticed before anyone showed them a report: the practice owner told the DSO’s CEO that the phones had stopped ringing.
On our side, the website’s visitor line fell when the ads stopped and stayed low until they came back. The pilot didn’t track calls, so we have no call count for those weeks, and we don’t give one. What we have is the office’s own account.
“The feeling in the office could feel the reduction in marketing spend.”
Back on: a different problem.
When the campaign came back, so did the calls. The CEO stopped by the practice and asked how it was going. The owner said they had a different problem now.
“The phone’s ringing so much, we gotta pull the dental assistant out of the operatory.”
That line is an anecdote, told to us secondhand, and we treat it as one. The CEO said as much himself.
“If you looked at the numbers, I don’t know, but it felt busy.”
It worked as one connected path.
The story earned attention. The request page caught the intent. Take out any one step and the rest stop adding up.
- Practice storyA real person gives the message a face.
- Paid adMeta shows and tests the message.
- Request pageThe page continues the same story, for the right office.
- InquiryThe form records which ad and page it came from.
- Follow-upThe office calls, books and tracks who comes in.
The blind spot
What we could see, and what we couldn’t.
Midway through the pilot, the practice asked us a fair question: was CareRM tracking the patients who scheduled, or only likes and views?
The honest answer was no. We could see the forms, the visits to the request pages and, for visits from an ad, which ad. We could not see calls, and we could not see who booked.
“We can’t tell who actually schedules. As far as we can go is who filled out the form.”
| Ad and website data show | Only the practice’s records show |
|---|---|
| Spend, impressions and Meta’s inquiry events | Unique contacts and qualified inquiries |
| Cost per event, ad by ad | How fast the office answered, and who it reached |
| Request-page activity by week | Booked and attended appointments |
| Which ad each form came from | Accepted treatment, revenue and return on spend |
Why every practice sees it now.
That gap is what the platform closes today. Calls come in through local tracking numbers, with recordings and transcripts. Every call and form lands in one list with the ad, search result or referral it came from. With the practice management system connected, each lead is followed to showed, accepted and collected, in one login the practice and the DSO both open.
The two screens below are today’s platform, from our demo practice. They are not the pilot’s data. The pilot practices’ own records stay private.
Today’s platform, not the pilot’s data
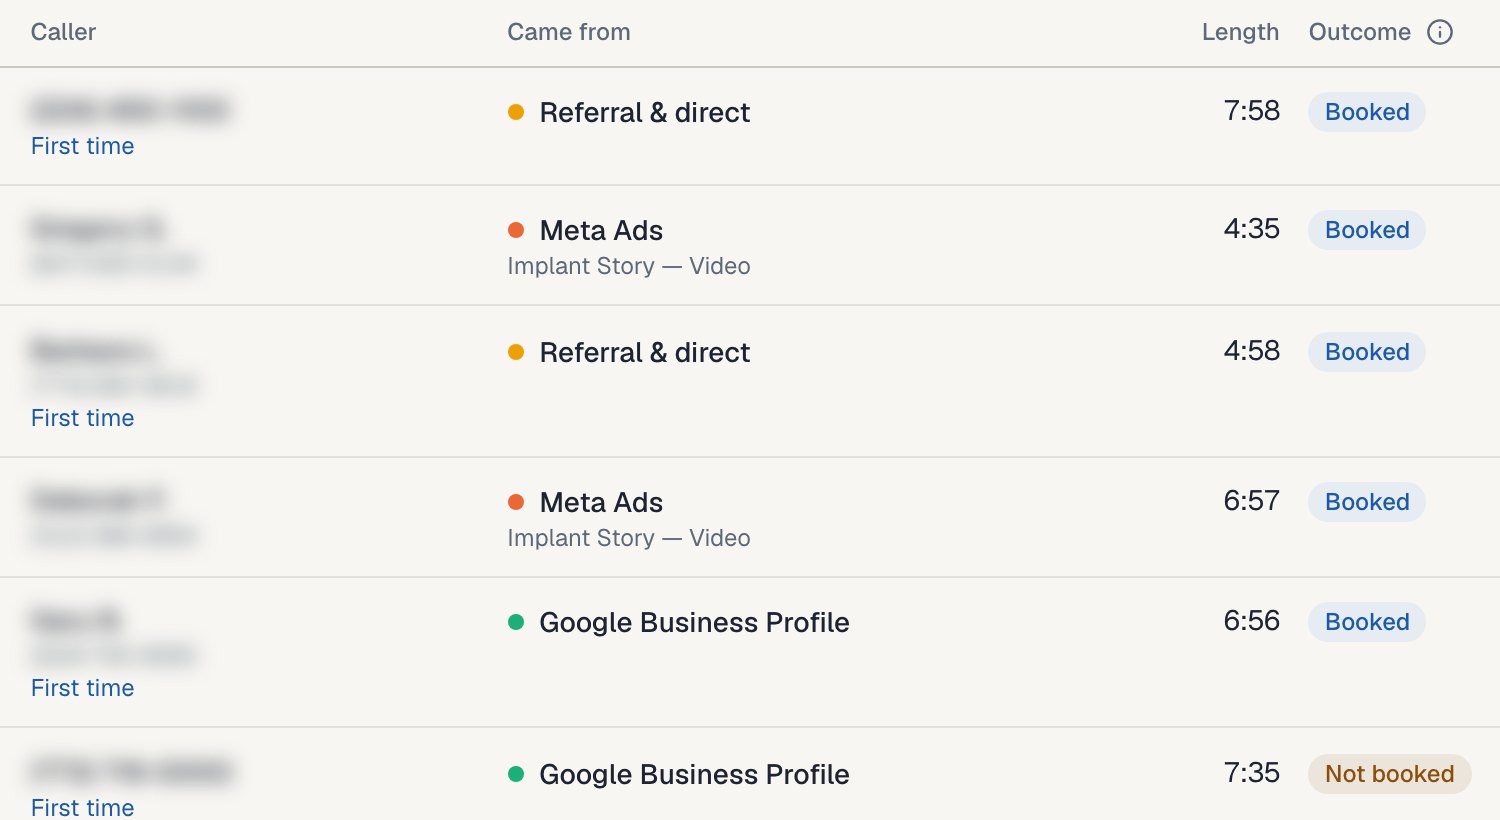
Today’s platform, not the pilot’s data
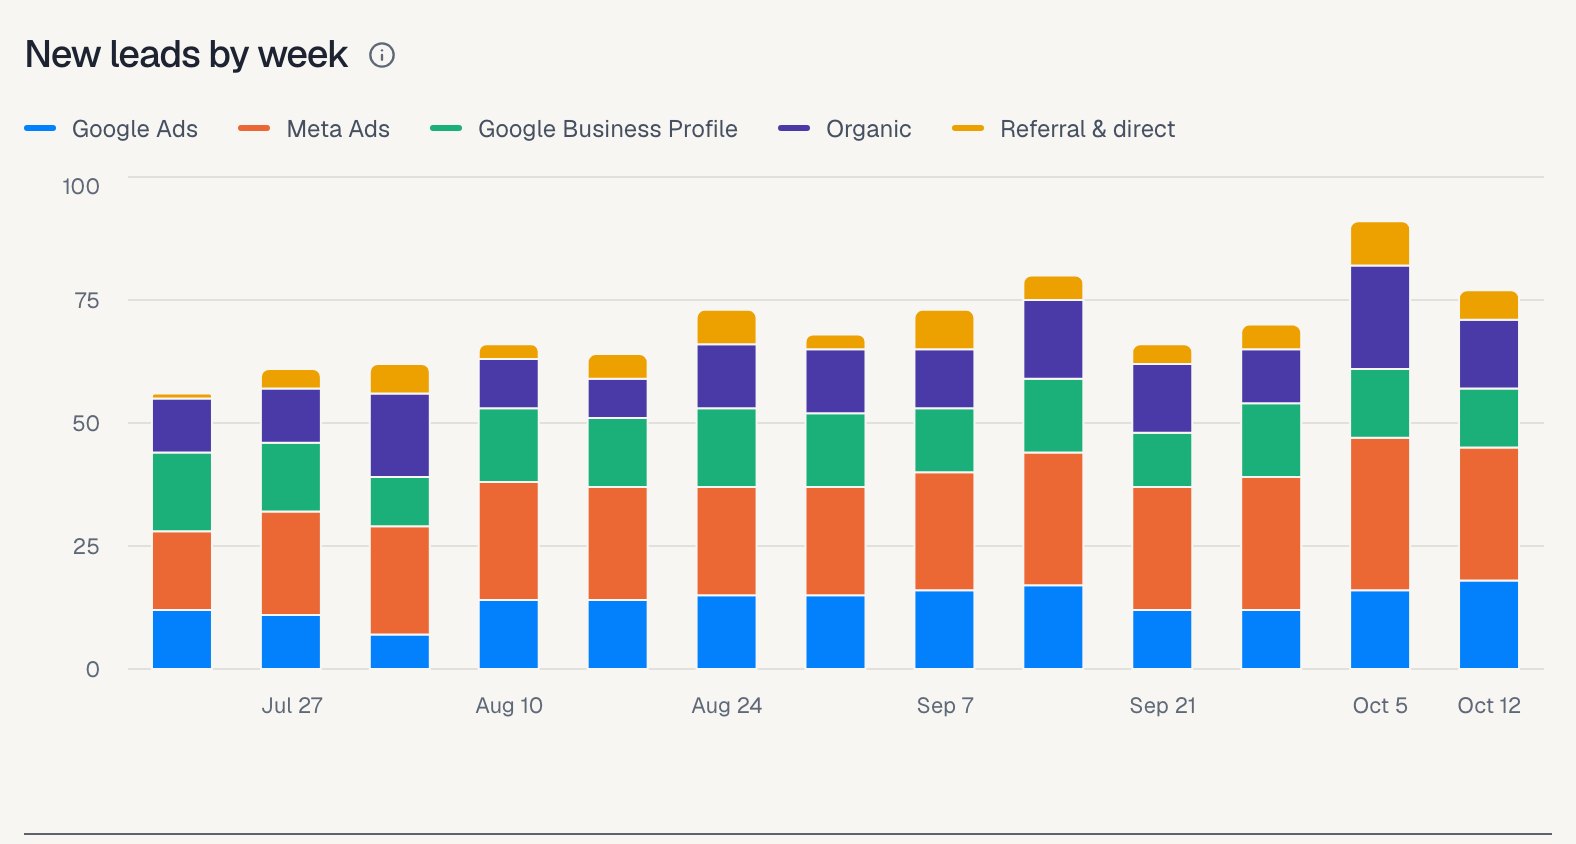
The result
What changed for the practices.
Two offices, one shoot day, one campaign. Request-page activity rose about 31.5×. Meta counted 181 new inquiries at $34.63 each. The front desk got busy enough to pull an assistant out of the operatory to answer the phone. And every form showed which ad and which office it came from.
What made the difference was simple: the practice’s own people in the ads, and a request page that matched each ad, so every form showed where it came from.
You don’t need to be part of a DSO for any of this. Everything above happened at two offices, with one shared team and a front desk each.
Plan one people-first campaign.
Use one location and one growth goal. Keep the first test small enough to learn from. Answer these six before you spend anything.
- Who should tell the story?A doctor, a team member or a patient
- What should a prospective patient understand?One reason to choose this office
- What will the page after the ad continue?The same person, place, offer and next step
- What will count as an inquiry?Decide before launch
- Who follows up, and how fast?Name one person and a target response time
- What proves it was worth it?Booked, attended and accepted care
Get this for your practice
Tell us where to start.
One practice or a group of locations. A person on our team reads every request and replies within one business day with times for a 30-minute call.
- What a new patient finds when they look you up
- What your website tells ad companies today
- The ads, website and tracking we would start with
Prefer email? Write to kai@carerm.com.